Home The Technical Indicator Series
Trading Indicators
Ten Popular Indicators Every Trader Should Know — A Quick Primer on Stock Charts with Indicators, Tested on Decades of Market Data
Every charting platform gives you the same indicators. Which ones actually tell you something?
Read it in an afternoon. Use it at the chart for years.
Moving averages, MACD, RSI. You see them on every stock chart, and you've heard the rules that go with them: buy the golden cross, sell when RSI hits 70, get ready when the bands squeeze. But has anyone checked whether those signals hold up?
This is a quick primer on the ten most popular tools in technical analysis: what each one measures, how to read it, and when to use it or leave it alone. Then each chapter does what most trading books never do. It tests the indicator's best-known rule against decades of market data, using every stock in the S&P 500 since 1990, including the companies that later failed.
The questions are the ones traders actually ask. Is the golden cross a buy signal, or is the move already over by the time it appears? Does an overbought RSI reading mean the stock is about to fall? When the bands squeeze tight, can you tell which way price will break? Do Fibonacci levels attract buyers, or does something else decide whether a pullback holds? Where should a stop go so an ordinary day's noise doesn't knock you out?
The results are candid: where a popular rule gives no edge, the book says so, and where an indicator earns its place, it shows you how to use it. It's the natural place to start with the Technical Indicator Series, since each chapter points to the book that covers its indicator in full.
Inside the book
- Plain-English chapters on moving averages, MACD, RSI, volatility bands, the squeeze, volume, VWAP, anchored VWAP, volume profile, and Fibonacci retracements
- A bonus chapter on Average True Range
- A worked example in every chapter, with the entry, stop, and position size calculated step by step
- A quick-reference table of every indicator and every finding, for use at the chart
Ten chapters plus a bonus chapter, and 60 charts and illustrations of real stocks and worked setups.
Look inside
A few pages from the paperback. Select a page to see it full size.
- The contents
- The opening of Chapter 1
- Figure 1.1: three moving averages on Apple
- Figure 5.2: the four stages of a squeeze
Who it's for
New traders learning to read stock charts with indicators, and swing traders who use these tools every day and want to know which signals deserve their trust.
Where to go next
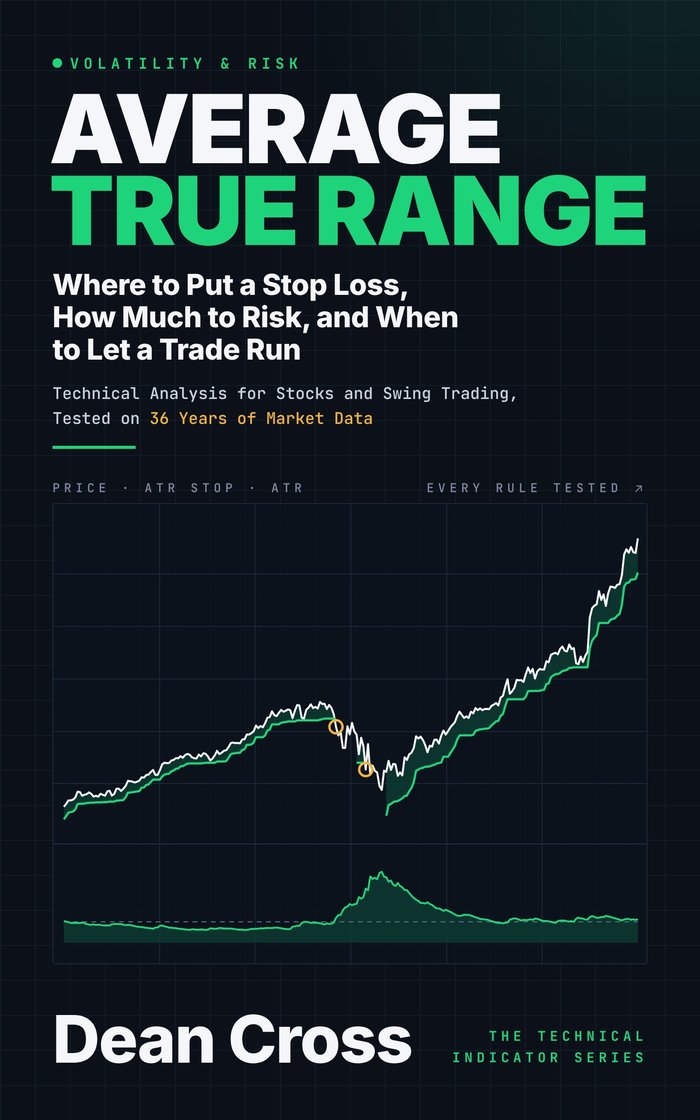
- The Technical Indicator SeriesAverage True Range
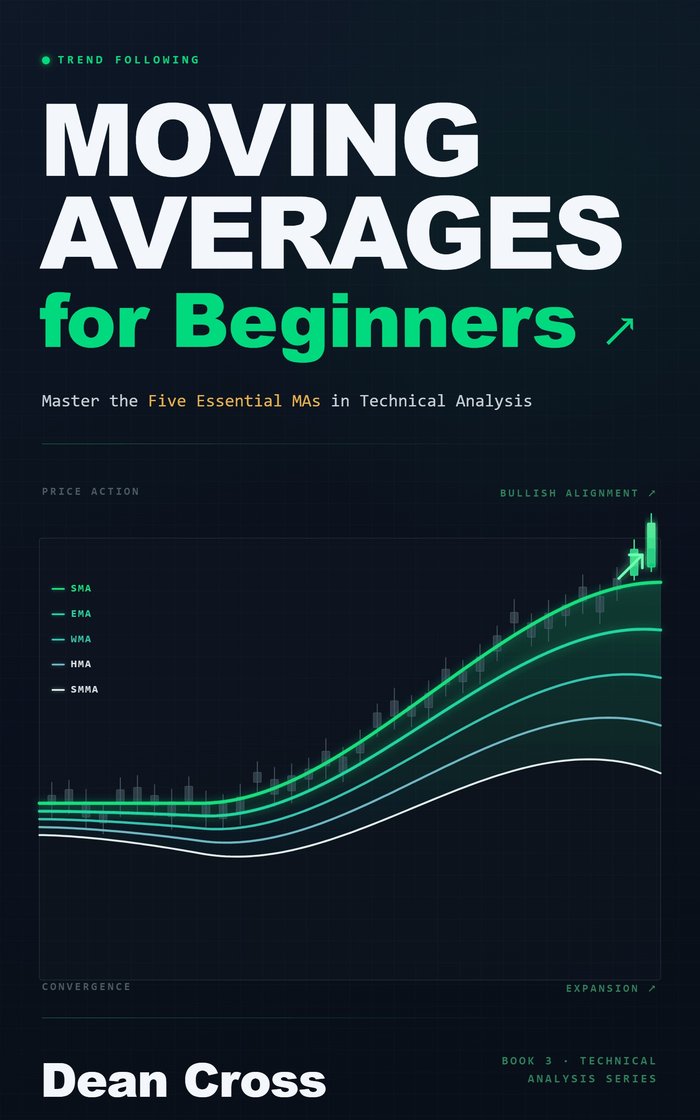
- The Technical Indicator SeriesMoving Averages for Beginners
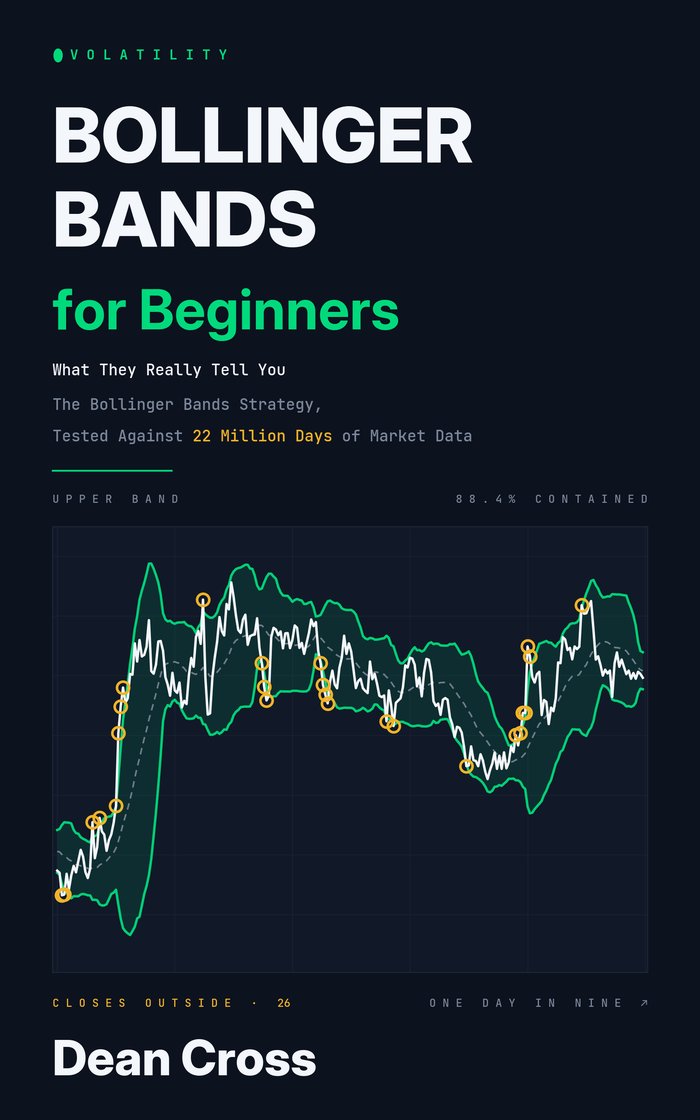
- The Technical Indicator SeriesBollinger Bands for Beginners
Get new findings and releases by email
New books, free Kindle days, and tested findings. Free; unsubscribe anytime.