Home The Technical Indicator Series
Bollinger Bands for Beginners
What They Really Tell You — The Bollinger Bands Strategy, Tested Against 22 Million Days of Market Data
The number everyone quotes about Bollinger Bands is wrong, and trading on it costs money.
The bands were never a compass. They are a ruler.
Charting platforms say the bands, set two standard deviations from the average, contain about 95% of price action. Measured across 22.8 million days of real prices, the figure is 88.4%. That gap matters: at 95%, a close outside the bands would happen about once a month. At 88.4%, it happens about one day in nine, two or three times a month. That is far too common to treat as a signal.
Every number in the book comes from daily prices for 8,929 US-listed stocks and funds, every trading day from 2010 through 2026, with nothing sampled or left out. The methods and definitions are printed in an appendix, so you can reproduce any figure or catch an error in it.
What the bands turn out to be good for is distance, not direction. A full chapter shows they have nothing useful to say about which way a stock will go. They do give a solid answer to how far it is likely to travel over the next month, and that is the number that decides how many shares to buy and where a sensible stop belongs. With $500 at risk on a $100 stock, a stock in the calmest tenth of its own year supports 92 shares; in its jumpiest tenth, 65.
What the book does not contain is just as deliberate: no entry signal, no stop-loss formula, no target, and no win rate. They were searched for across sixteen years of prices and nearly nine thousand companies, and they aren't there. Instead you get a way to size positions by measurement, a short list of habits to drop, and a one-page procedure with every line traced to a chapter and a number.
Habits the data retires
- Fading band touches, which loses money
- Buying band touches, which loses money in the other direction
- Acting on the first day of a touch, when half are over by the next close
- Sizing up after a long quiet stretch because a big move must be coming (tested across 330,000 quiet stretches, with no relationship found)
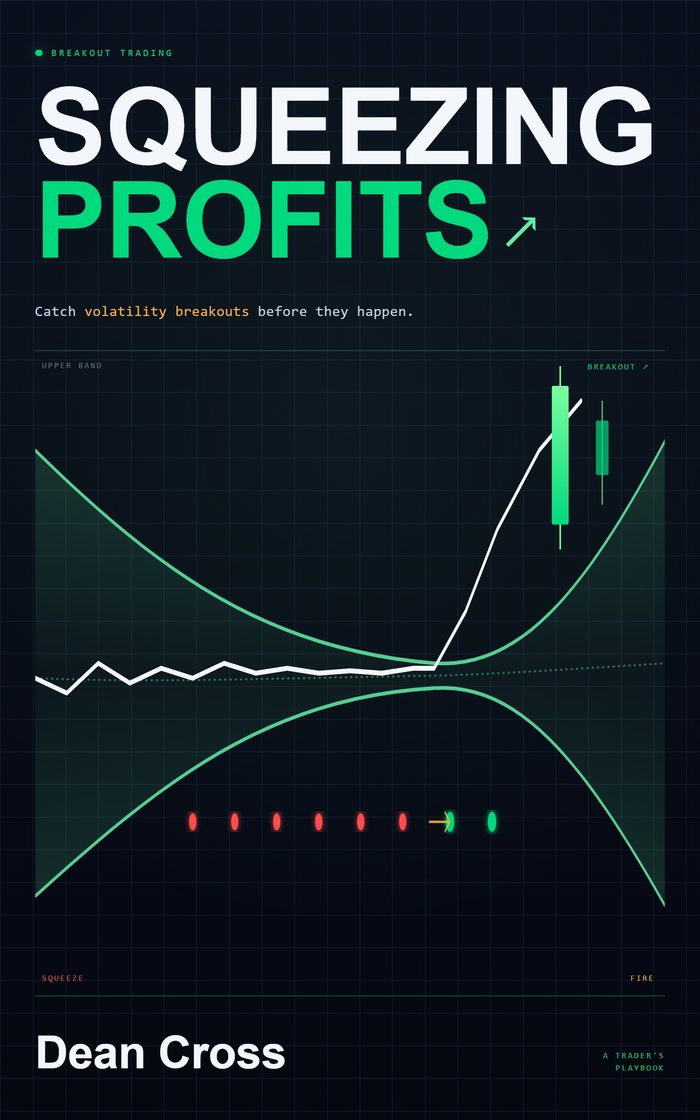
- Reading a squeeze as a direction call (of 199,097 breakouts, 49.7% resolved the expected way)
Tested on 8,929 US stocks and funds, 2010 through 2026: about 22.8 million days of prices.
Look inside
A few pages from the paperback. Select a page to see it full size.
- The contents
- The opening of Chapter 1
- Figure 1.1: every close outside the bands in a year
- Figure 5.1: what band width says about the next twenty sessions
Who it's for
Traders who use Bollinger Bands and want to know which of the common rules hold up, and what the bands are genuinely good for.