Dean Cross

Home Series

Reading the Chart

Price charts from the ground up: candlesticks, support and resistance, trendlines, chart patterns, volume, market structure, and gaps.

This series does something most charting books never do: it tests the rules. Each book checks the classic claims against more than twenty years of US stock data, so you learn not just what a pattern is supposed to mean but how often it actually does.

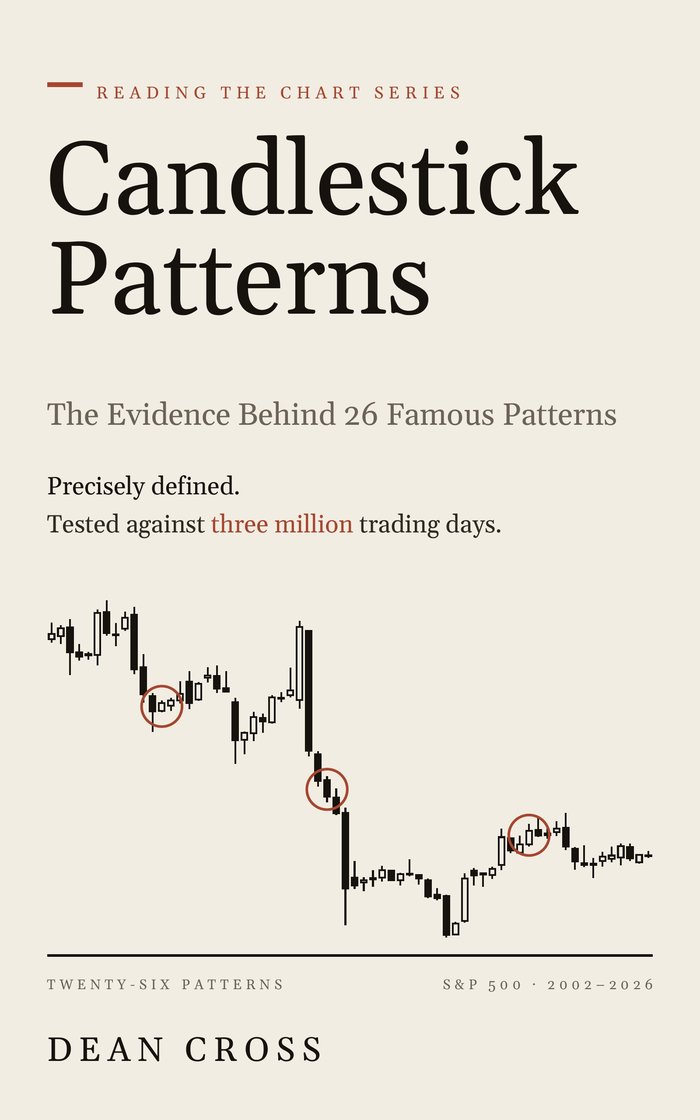
Cover of Candlestick Patterns

Candlestick Patterns

The Evidence Behind 26 Famous Patterns — Precisely Defined and Tested Against Three Million Trading Days

The hammer is the most famous bullish candle in trading. After a hammer, price was higher less often than after an ordinary day. That result comes from testing 26 well-known candlestick patterns against every company in the S&P 500, counted only on the days it was actually in the index, from January 2002 to September 2026.

Read more about this book

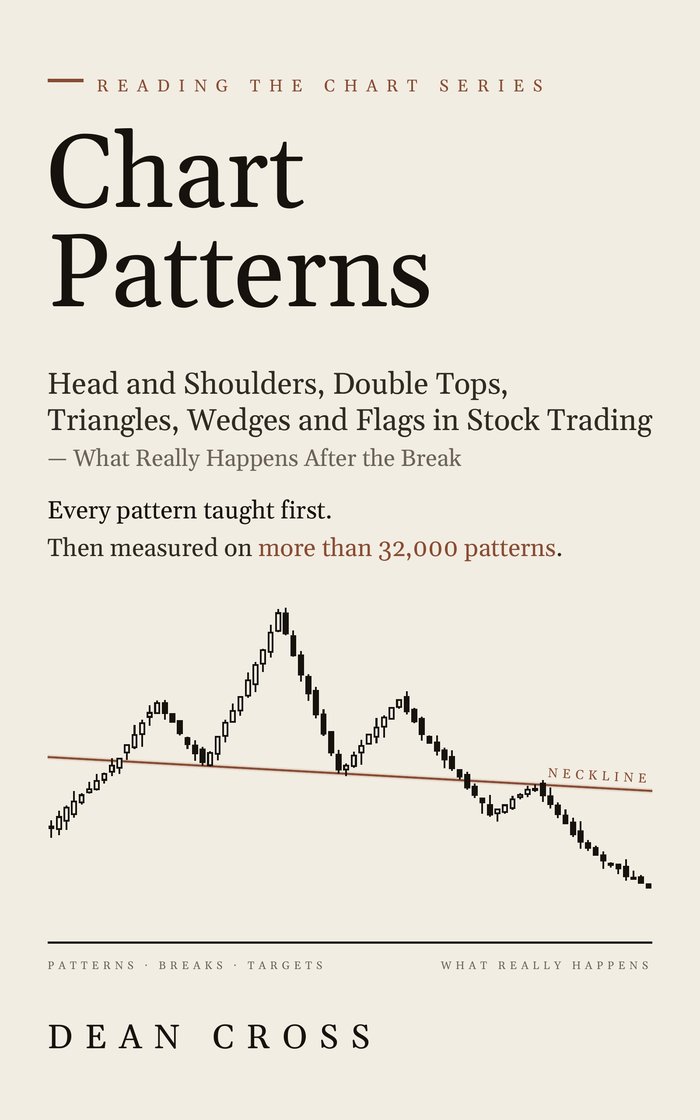
Cover of Chart Patterns

Chart Patterns

Head and Shoulders, Double Tops, Triangles, Wedges and Flags in Stock Trading — What Really Happens After the Break

You spotted the pattern. What does price really do next? Head and shoulders. Double tops. Triangles, wedges and flags. Every trading book teaches the same shapes and the same rules: wait for the break, measure the target, put the stop at the far end.

Read more about this book

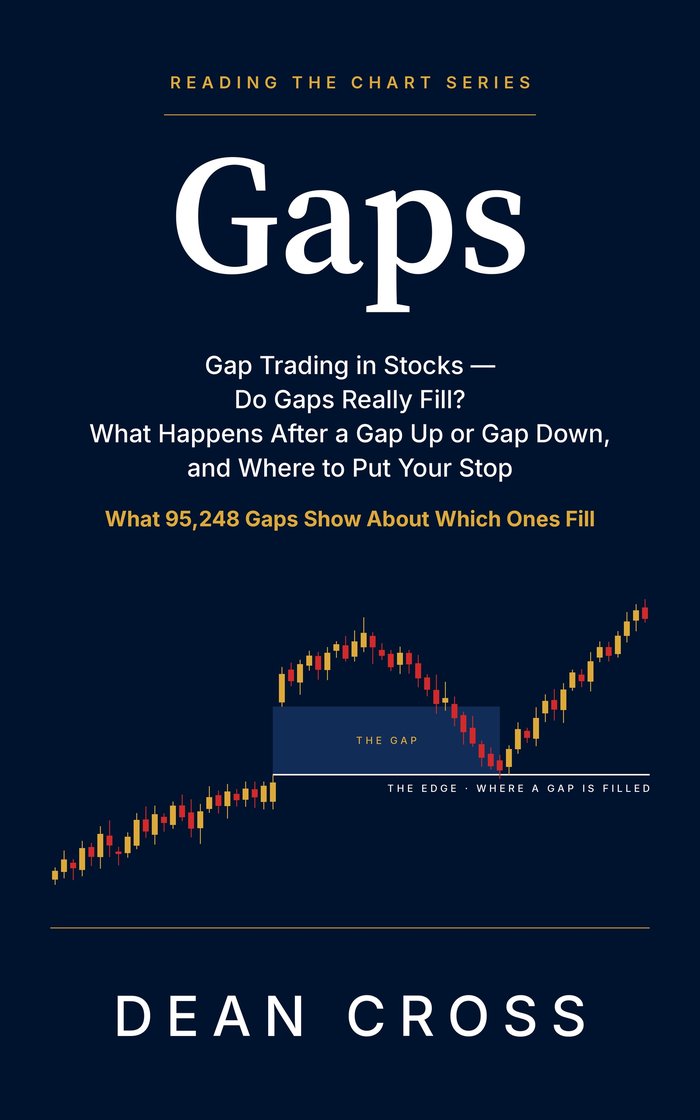
Cover of Gaps

Gaps

Gap Trading in Stocks — Do Gaps Really Fill? What Happens After a Gap Up or Gap Down, and Where to Put Your Stop

Everyone says a gap will fill. Will yours? Your stock opens well above yesterday's high, or far below yesterday's low. Now what? Most gap traders answer these from rules of thumb that nearly every trading book repeats.

Read more about this book