Home The Technical Indicator Series
The RSI Swing Trader
A Complete System for Timing Stock Trades with Relative Strength — Confirmed by Trend, Volume, and Risk
Most traders don't lose to bad stocks. They lose to good rules applied to the wrong market.
You've felt it. A strong stock breaks out, RSI climbs into the seventies, the textbook says sell — so you sell, and the stock runs another forty percent while your discipline watches from the sidelines. Or a falling stock turns "oversold," the book says buy, and you catch the knife. You didn't make a mistake. You followed rules written for a sideways market, in a market that was trending.
That single mismatch is why RSI fails most swing traders. The standard thresholds describe a range-bound stock; the moment a real trend takes hold, they invert — flushing you out of winners early and pulling you into losers late. The indicator isn't broken. It's being read without the one thing that gives it meaning: the trend around it.
The RSI Swing Trader puts that context back. This isn't a collection of indicator tips — it's a complete, end-to-end system for trading stocks with RSI, from finding the right names to timing the entry to protecting the position.
You'll learn to:
- Read the weekly trend first and take daily signals only in the direction it allows — so you trade with the move instead of against it
- Reset your overbought and oversold lines to the stock you're actually in (Cardwell ranges), and ride strong trends instead of selling into them
- Separate a true reversal from a trap using trend strength (ADX), volume, and divergence read the right way
- Rank the market and trade its genuine leaders, using relative strength to find them before any signal fires
- Pinpoint entries by lining up the weekly and daily charts
- Size every trade against a volatility stop, so a wrong read is cheap and a right one compounds
Every method is built on real market data and shown, not just described, across 34 full-color charts — printed on a larger 7×10 page so price, RSI, and every annotation stay readable instead of shrinking into a cramped paperback. It all assembles into one regime-first framework you can run like a checklist, then earns its keep across six fully worked trades in real, named stocks — winners and losers both, walked from entry to exit without flinching. A quick-reference guide, the exact formulas, a glossary, and a backtest appendix make it a book you'll keep open beside your charts long after the first read.
No promise of easy money. No secret signal. Something more durable: a disciplined, repeatable way to read momentum in the context that makes it trustworthy — and the judgment to know when RSI is telling you the truth and when it's lying.
If you know the standard RSI rules and have watched them fail on a daily stock chart, this is the book that shows you why, hands you a system that works the way real trends do, and gives you back the trades the textbook talked you out of.
Stop trading the rulebook for the wrong market. Start reading the one in front of you.
Look inside
A few pages from the paperback. Select a page to see it full size.
- The contents
- The opening of Chapter 1
- Figure 2.1: the overbought trap, in Nvidia
- Figure 12.2: Trade 6, the loser
Who it's for
Swing traders who know the standard RSI rules and have watched them fail on a daily chart.
Where to go next
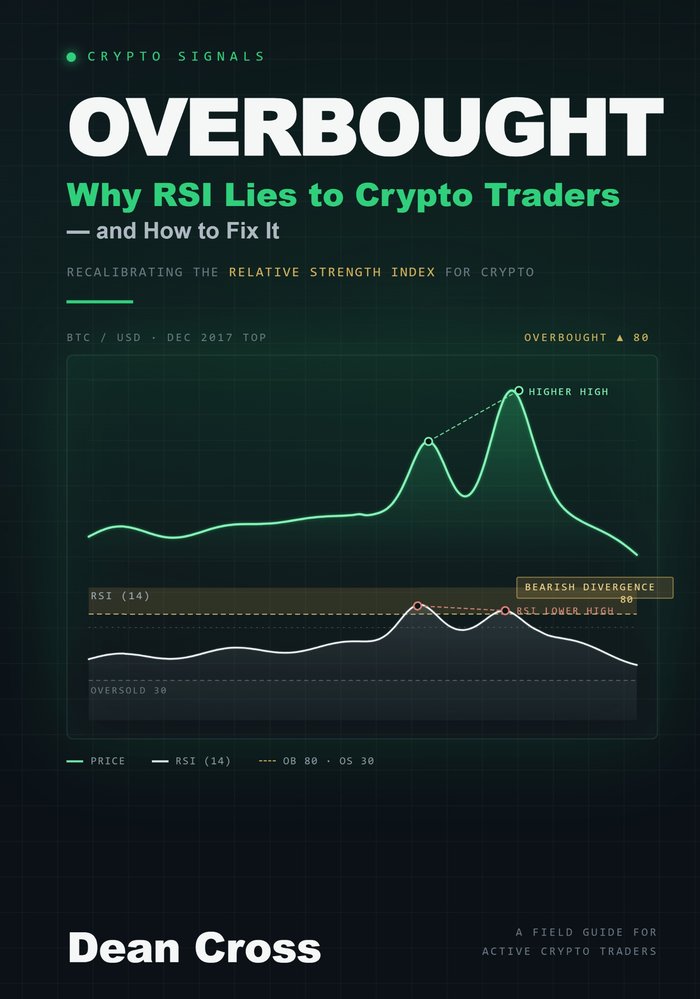
- The Technical Indicator SeriesOverbought
- The Technical Indicator SeriesMoving Averages for Beginners

Get new findings and releases by email
New books, free Kindle days, and tested findings. Free; unsubscribe anytime.